Challenge 3 McNulty Project
Project 3 McNulty Project — Climate Change and Human Activities
Story
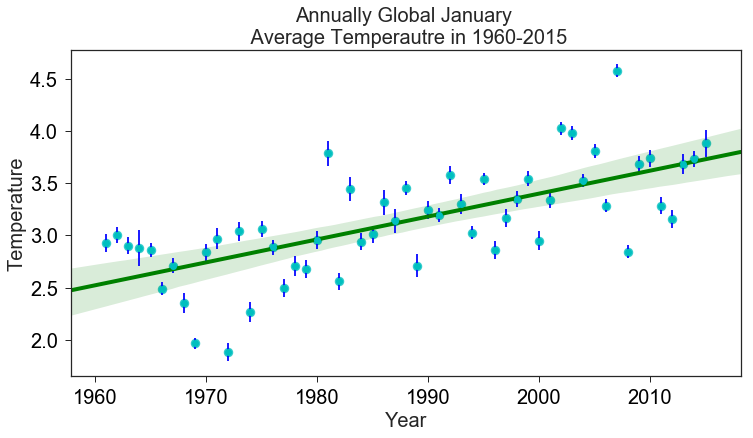
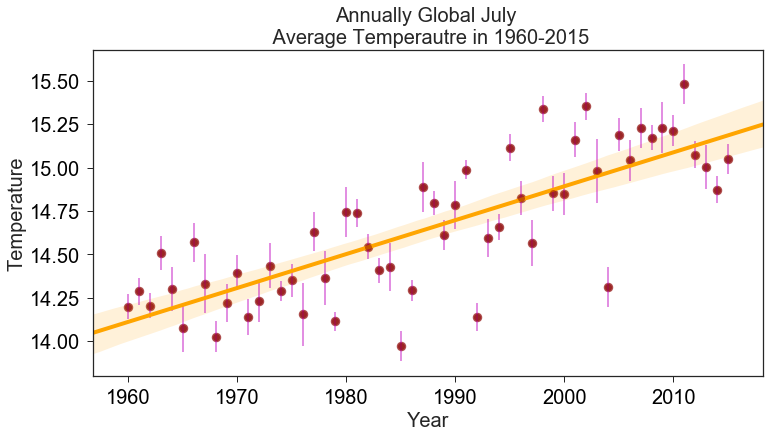
Global warming is happening according to monthly global temperature data from Kaggle. To modeling climate change is a complicated problem. It's related to the sun, the sea, the current, and the human activities, etc. This project will only focus on several reasons that caused by human activities to the climate.
Well, how does it related to the countries?
Which country's temperature is changing a lot?
Data
Global temperature datais from Kaggle.
Country economic data, like GDP, world development indicator, climate change data and etc., is from World Bank.
D3 Bubble Chart for Countires
Δ Temperature vs. Features over Time
Circles: Countries
Radius: Population
Color: Δ Temperature
Mouseover the year to move forward and backwards through time.
This is inspired by <a https://bost.ocks.org/mike/nations>Mike Bostock's work</a> on Gapminder’s Wealth & Health of Nations, made famous by Hans Rosling’s memorable 2006 TED talk.
Presentation Slides for the Project
Reference
How to resize figure: https://github.com/hakimel/reveal.js/issues/1349